Mountain Beltway has relocated

The blog’s new home is nestled into the cozy embrace of the American Geophysical Union. You can find it at this new URL:

http://blogs.agu.org/mountainbeltway/

There, Mountain Beltway joins six other independently-authored blogs in what is the first example (in geology, anyhow) of a professional organization hosting a series of blogs whose authors have editorial control of their content. I think the AGU deserves major kudos for this gutsy move, and major props should be given to Maria-Jose Viñas, the AGU public information officer who has pushed the organization to embrace new media. I was honored to be invited to be one of the inaugural group of AGU-hosted geobloggers, and I hope to see our community grow in the future.

The new RSS feed is http://blogs.agu.org/mountainbeltway/feed.

If you’ve commented here in the past week, you might find that your comments didn’t get packed up in the transition. I’d encourage you to copy and paste them into the new versions of the posts at the AGU site: I can’t do that for you.

See you in the blog’s new digs!

Tavşanlı Zone field trip, part 3

Picking up where we left off last time, we were in some partly-serpentenized peridotite, part of the Burham Ophiolite in Turkey’s Tavşanlı Zone, an ancient tectonic suture.

Our next stop on the field trip allowed us to visit some diabase dikes:

tav_3_01

Here’s a close-up of the right contact of the dike with the host peridotite:

tav_3_02

The field notebook’s long edge is ~18 cm. And here it is again, annotated:

tav_3_02anno

Near the village of Oranheli, we stopped to examine a jadeite meta-granitoid, a rock only a metamorphic petrologist could love. There were, however, a lot of metamorphic petrologists on the trip, and they were very keen on checking it out. This was the first of many occasions when random Turkish citizens would stroll up to our odd group to find out just what the hell we were doing:

tav_3_03

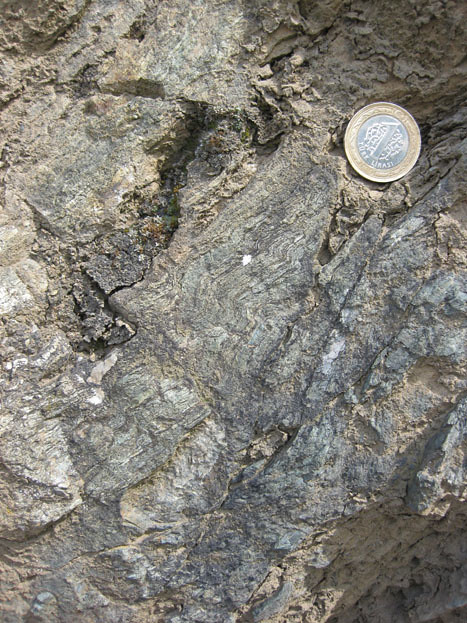
Further along, we saw a meta-basite (meta-basalt) within the meta-granitoid, and there I got a refreshing whiff of structure. Here’s a random isoclinal fold of a meta-granitoid dike cross-cutting the meta-basite, with a Turkish 1-lira coin (about the same size as a U.S. quarter) for scale:

tav_3_04

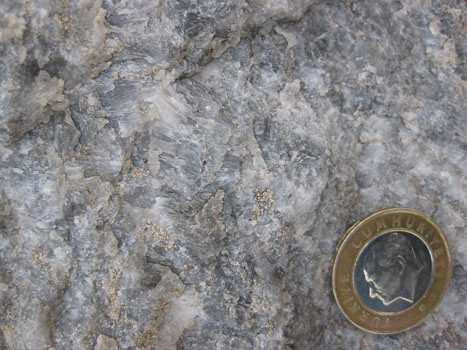
Next up were some very cool rocks: marbles with extremely elongated calcite crystals.

tav_3_05

These needle-like crystals are interpreted as being pseudomorphs of aragonite, the form of CaCO3 which is stable at high pressures and low temperatures.

tav_3_16

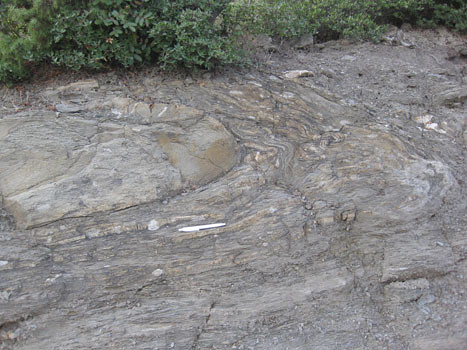
A bit further on, we return to metamorphosed shale and graywacke (now schist and “grayfels”), sheared out and pervasively deformed at blueschist conditions. I took a few photos of charismatic folds in the unit:

tav_3_09

Annotated, roughly showing the trace of foliation:

tav_3_09anno

Sandy layer folded over into a recumbent position, set in a sheared mass of meta-shale:

tav_3_06

Thicker sandy layer, in a recumbent isoclinal fold (white pen, 14 cm long, for scale):

tav_3_08

Zooming in on the above photo, to show the lovely, smaller wavelength parasitic folds which decorate the snout of the big fold:

tav_3_07

Extensional fractures along an isoclinally-folded, recumbent sandy layer:

tav_3_10

Small S-folds in the sheared shale (just above hammer):

tav_3_11

Coming down onto this roadside outcrop of sheared shale and graywacke were cobbles and boulders of float from somewhere up above. They were of a quartz-pebble conglomerate that showed a stretching lineation. Check out these two faces of typical samples:

tav_3_14

tav_3_15

Now, here they are again, with the X, Y, and Z axes of the strain ellipsoid (longest, intermediate, and shortest, respectively) labeled for your benefit.

tav_3_14anno

tav_3_15anno

This conglomerate has been sheared into a lovely L-S tectonite, with X>Y~Z. In other words, it’s mostly lineated, with only a weakly-defined foliation, indicating the stress field was mostly constrictional. (I collected a muddy sample of this stretched-pebble meta-conglomerate, and when I washed it off in the hotel shower the next morning, I was delighted what a cool sample I had selected. It has some awesome structural features; I’ll show it to you some other time…)

Our final stop of Day 1 of the trip was this spectacular overview of the Kocasu Gorge, a canyon which cuts across the structural trend of the area at approximately a right angle. (The canyon cuts north-south; the strike of the folded & thrusted rock units runs approximately east-west.)

tav_3_13

As the sun set, Aral showed us where we were, and the overall synclinal structure of the area.

tav_3_12

I recorded it in my field notebook like this:

kocasu

With this context established, we loaded back on the bus and drove for a couple of hours to get to a town with a decent hotel. We dined and slept, and the next morning got up ready for more suture-zone rocks.

Friday fold: twice-folded turbidites at Black Pond

Today’s Friday fold comes to us courtesy of Gary Fleming, botanist extraordinaire and brother of Tony Fleming, geological Jack of All Trades. Together, the Fleming brothers led a field trip for the Geological Society of Washington. While I was on that field trip, the topic of polyphase deformation came up, which led a couple of weeks later to Gary sending me this photograph. He took this photo in the Black Pond area, on the Virginia side of the Potomac River near the property of Madeira School:

mathergorgefm_blackpond

That’s a set of twice-folded folds. The earlier generation of folds are quite tight enough that their limbs are parallel; we call this “isoclinal.” They display axial planes that run left-to-right across the photo. They are overprinted by a second generation of folds which are more open and broad. The second generation folds have axial planes which run top-to-bottom across the photo. Here’s an annotated copy showing the undulating form of the folds:

mathergorgefm_blackpond_anno

And here I’ve tacked on some color-coded axial plane traces: the first generation of folding (F1) is in yellow; the second generation (F2) is in blue:

mathergorgefm_blackpond_axes

The rocks in question are turbidites of the Mather Gorge Formation, folded up during the late-Ordovician episode of mountain building called the Taconian Orogeny. Relative to the orientation of this photograph, the F1 folds would have resulted from top-to-bottom compression, while the F2 folds would have resulted from a later episode of side-to-side compression.

It’s also worth noting the collection of small parasitic F2 folds in the schisty section at the top of the photo (greenish-gray, and partially obscured by mud).

Happy Friday! If your week has left you as contorted as these rocks, I hope you have a relaxing weekend…

Thanks to Gary Fleming for sharing this image and letting me publish it here.

Tavşanlı Zone field trip, part 2

Yesterday, I shared a few thoughts about the first couple of stops on the field trip I took earlier this month from Istanbul to Ankara, prior to the Tectonic Crossroads conference. Today, we’ll pick up with some images and descriptions from the next few stops.

After lunch, our next stop brought us to a relatively low-metamorphic-grade outcrop of sheared graywacke (dirty sandstone) and shale. As you can imagine, it wasn’t particularly photogenic. Bedding was continuous only over a scale of a meter or two. It’s what suture-zone workers call “broken formation,” part way between undeformed rocks and a full-blown mélange. (It’s internally sheared up, but not yet mixed with adjacent formations.)

Looking back the way we had driven in, though (i.e., looking to the north), we could see the west-ward dipping limb of a large syncline exposed on the mountainside over yonder:

tav_1_08

Annotated version:

tav_1_08anno

The Orhanler Formation is the lowermost unit, layers of graywacke and shale that are probably Triassic in age. It is overlain by the thin sandstones of the Bayırköy Formation (Liassic), and then the limestone which is proving so irresistible to quarry excavators, the upper Jurassic Bilecik Limestone.

Our fourth stop was one of the ones that got me really excited. In fact, almost everyone on the trip seemed to get pumped up from visiting this outcrop. Check it out:

tav_2_01

The yellow field notebook’s long edge measures ~18 cm. Behind the notebook, my friends, is a layered gabbro. The stripes you see result from differing ratios of light and dark colored minerals — plagioclase and pyroxene, mainly. But why is it layered? Is this an example of a cumulate texture; a primary igneous structure resulting from the settling of crystals onto the floor of a magma chamber? Or is this a tectonic foliation, resulting from strain the rock has accumulated? It was introduced to the participants on the field trip as an example of the former, but several of us found this argument less than totally convincing, as the size of this rock body is ~200 km long and ~2 km thick. It’s awfully hard to envision a magma body that size. I found it easier to imagine this as a chunk of the mantle, as Alain Tremblay suggested to the group.

As I poked around the outcrop, I found something which was consistent with a deformational (rather than cumulate) origin to the layering…

tav_2_07

That’s an S-fold! Turn this cobble around, and on the other side, you can see a Z-fold:

tav_2_08

I suppose that tight little folds like this could have come in some stage of ductile deformation after an original cumulate layer formed, but that would require an episode of deformation not required by the foliation hypothesis. If these are planes formed by mantle flow, I’d expect a few small folds in those layers at the time that flow was forming them. Besides the blueschists and eclogites, the Tavşanlı Zone includes an ophiolitic suite, and having chunks of mantle there would in no way be a shocker.

Regardless of the origin of the mineralogical layering, I think we can all be pleased to learn that it is deformed. A series of “reverse” ductile shear zones cut across the layering, as you may be able to discern in this photo:

tav_2_02

Notice how the gabbro’s layers deflect towards the fault(s) in a “drag fold” fashion, tipping over to the left. Close up:

tav_2_03

Left of the notebook, you can see this gentle deflection quite nicely:

tav_2_04

This is sweet, right? I’m loving it.

tav_2_05

A close-up shot that particularly satisfies me:

tav_2_06

Note the thinning and rotation of the mineralogical layers as you get closer to the shear band at the center of the shear zone itself (far right of photo). Pen for scale.

We also stopped at a proper peridotite outcrop (no one’s arguing that this one isn’t mantle), which had serpentine veins cutting though it:

tav_2_09

More later

By the way, this blog’s move to the AGU servers has been postponed until probably Monday.

Tavşanlı Zone field trip, part 1

Before the Tectonic Crossroads conference two weeks ago, I had the good fortune to participate in a Istanbul-to-Ankara geology field examining the Tavşanlı Zone, a tectonic suture zone where a portion of the Tethys Ocean basin closed. This paleo-convergent boundary is marked by a suite of interesting rocks, including blueschists, ophiolites, and eclogites. I’d like to share with you some of the things I saw along the trip.

This is one of the trip leaders, Aral Okay (pronounced “Oh-kai,” okay?), discussing the general geology of the area at our first stop. (The other trip leader was Donna Whitney.)

tav_1_01

I think in general, you can make out the east-west trend of the rock units on Aral’s map (where they aren’t obscured by alluvium). This reflects the approximate north-south convergence of the Tethys closure in Turkey. To visualize this, I’d like to call your attention to a paleogeographic interpretation of the Tethys Ocean from Ron Blakey, the talented mapmaker from Northern Arizona University:

tethys

See all those colliding east-west-oriented crustal fragments in the northwestern Tethys? Those are the pieces that will comprise future Turkey. As you can imagine, rocks caught up in these tectonic collisions got both deformed and metamorphosed. Some of them were even subducted to ~80 km depth, and then brought back up to the surface! At our first stop, we saw some blueschist-grade rocks that had a phyllitic texture. Here’s two of them:

tav_1_02

As usual, my eye was drawn towards the structures visible in these rocks. Here are a couple of nice little folds:

tav_1_03

tav_1_05

(The Turkish 1-lira coin is the same size as a U.S. quarter.)

I found this to be an interesting portion of the outcrop:

tav_1_04

That’s green phyllite on the left, and blue phyllite on the right. Allow me to annotate it for you:

tav_1_04anno

“Blueschist” and “greenschist” refer to two assemblages of minerals which supposedly represent different combinations of temperature and pressure. They are examples of metamorphic “facies,” as illustrated in this image:

facies

Image redrawn and modified by me from Figure 3 of Bousquet, et al. (2008), which is itself modified from Oberhänsli, et al. (2004), and also from University of British Columbia (1997), which is modified from Yardley (1988).

Theoretically, blueschists and greenschists should be forming at different combinations of pressure and temperature. Blueschist forms at high pressures, but relatively low temperatures. But here we have an outcrop of blueschist that is right adjacent to a greenschist (medium temperature and pressure), with no faulting in between. It was suggested to me by a blueschist expert that this was likely a reflection in differences in the initial composition of the protoliths. I found this explanation less than completely satisfying, but there was no time to discuss, for we were being called back to the bus, already gunning its engine and ready to roll down the road.

At our second stop, we found some metamorphic rocks that showed clear textural evidence of having had pyroclastic protoliths:

tav_1_06

There were lots of chunky bits in there.

tav_1_07

So it wasn’t just pelitic (muddy) rocks that were getting metamorphosed in this Tethyan suture zone, but volcanic rocks too!

More later… when we move on to stop #3

Birthing a litter of drumlins

ResearchBlogging.org Quite appropriately, Glacial Till won the new the latest edition of “Where on (Google) Earth?”, hosted here yesterday. The location I picked is the subject of a new paper by Mark Johnson and colleagues appears in the current issue of Geology (October 2010). It shows a place in Iceland where a piedmont-style outlet glacier called Múlajökull is pooching out to the southeast from the Hofsjökull ice cap. Here’s a more zoomed-out view of the glacier’s terminus:

ice_drum

Here, I’ve jacked the contrast up a bit, so you can see what’s so cool about this location — note the radial array of elliptical meltwater lakes…

ice_drum_2

The other outlet glacier, seen just to the west, is Nauthagajökull. With this context established, we can take a look at Figure 1 from the Johnson, et al. (2010) paper:

ice_drum_3

The red ellipses are between the lakes I pointed out earlier. They are drumlins, elliptical hills of glacial till. Drumlins are examples of the sub-set of glacial geomorphology which includes features made by deposition of glacial sediment (till). They are taller at the upstream end, and taper out downstream, a shape something like an “upside-down spoon.” Long-term readers will recall the time that I shared the experience of visiting some drumlins in New York, where I learned that “spoon” analogy from Paul Tomascak.

There are a lot of drumlins left over from the Pleistocene glaciation, but we don’t totally understand how they form. That’s what’s so exciting about the recession of Múlajökull: it’s exposing the world’s only known active drumlin field for geologic scrutiny. Johnson, et al., have documented 50 separate drumlins emerging from beneath the ice. Their field works has yielded some new observations that may shed light on how these distinctive landforms develop.

First off, they note that Múlajökull is a “surge-type” outlet glacier, which means that it pulses forward rapidly (4 times in the past 60 years), which isn’t the case for other glaciers, like neighbor Nauthagajökull. See the comparison in Figure 1d — where Nauthagajökull is relatively smoothly retreating, but Múlajökull has fits and starts. This may be important: Nauthagajökull hasn’t produced any drumlins.

Second, they documented various aspects of the drumlins at Múlajökull. They have an aerial aspect ratio of about 3.0, which is similar to what we see in the drumlin zones of New York and other Pleistocene drumlin fields. So that makes uniformitarians happy — maybe the dynamics of Múlajökull are analogous to the Laurentide ice sheet! Another, more detailed study, was made of the internal structure and stratigraphy of the drumlins, as exposed in channels carved into the drumlin laterally by flowing meltwater. The guts of the drumlin show multiple till units, the most recent of which truncates the ones below it in a subtle but discernible angular unconformity.The uppermost till can be traced to the end-moraine produced by the most recent (1992) surge of the glacier, but not beyond it.

They also note the presence of orange-colored water-escape structures, cutting across the till units and filled with fine sediment, and a pebble fabric which is parallel to the drumlin’s long axis (and ice-flow direction).

A final class of data is gained by taking a look at what the glacier’s snout looked like before it revealed its internal drumlins. Here’s Figure 5 from the new paper, which overlays the traced drumlin boundaries from Figure 1 on an air photo from 1995, a time after the glacier surged forward in 1992, but before the most recent recession of the terminus that revealed the drumlins:

icedrum4

The authors note that the crevasse pattern on the 1995 glacier is clearly related to the location of the drumlins that have recently emerged. A V-shaped pattern of crevasses may be seen immediately upstream from many of the drumlins’ positions.

After the 1992 surge, the glacial ice at the terminus of Múlajökull has been essentially stagnant: there are no recessional moraines between the 1992 surge end-moraine and the current ice front. Without moving ice, the authors find it difficult to imagine how drumlins could be formed. They infer that the drumlins formed during the surging stage of the glacier’s movement. The erosional basal contact of the upper till unit seen inside the drumlins suggests that erosion (as well as deposition) is an important part of the processes which form drumlins. Stress differences under and between crevasses cause slight differences in the rates of erosion vs. deposition the glacier bed. More till builds up beneath crevasses, less till accumulates between them. Time goes by, the glacier surges, and a big batch of new till gets added to the top of the drumlins. Amplifying feedback enlarges the drumlins with each successive surge, mainly on the upstream end and the sides of the drumlin. The authors interpret the drumlin’s internal stratigraphy of multiple till units as the record of multiple surges.

The authors of the new paper conclude by examining the two principal models for drumlin formation: a subglacial bed-deformation model from Boulton (1987), and a meltwater model proposed by Shaw (2002). They point out the truncated stratigraphy they observed inside the Múlajökull drumlins as evidence for the Boulton model, and a lack of sufficient meltwater to support the Shaw hypothesis.

Right now, Múlajökull is our only functional modern analogue for drumlin formation in the Pleistocene, but others may soon emerge. The authors also predict that as glacial recession continues to play out all over the world, we may someday observe other active drumlin fields, and gain further insights into what’s happening beneath continental glaciers.

___________________________________________

Boulton, G.S. (1987). A theory of drumlin formation by subglacial sediment deformation, in Menzies, J., and Rose, J., eds. Drumlin symposium: Rotterdam, Balkema, p. 25-80.

Johnson, M., Schomacker, A., Benediktsson, I., Geiger, A., Ferguson, A., & Ingolfsson, O. (2010). Active drumlin field revealed at the margin of Mulajokull, Iceland: A surge-type glacier Geology, 38 (10), 943-946 DOI: 10.1130/G31371.1

Shaw, J. (2002). The meltwater hypothesis for subglacial bedforms. Quaternatary Interational, v. 90, p. 5-22. DOI: 10.1016/S1040-6182(01)00089-1.

Where on Google Earth? #215

With a helpful Twitter hint from Ron Schott, I won my second “Where on (Google) Earth?” challenge, the 214th edition of this popular geoblogospheric competition. As a result, I get to host the next one, Where on Google Earth? #215.

The aim of the game is to figure out where on Earth this satellite imagery comes from, and then post the coordinates (lat/long, UTM, whatever) and give a brief explanation of the geologic significance of the region. (I’ve got a full post ready to go that goes into more detail on the region; so you need only sketch out the flimsiest of details.)

Post your answer in the comments section once you’ve figured it out. The winner earns the right to host Where on Google Earth #216. If you don’t have a blog of your own, then I’ll be happy to host it here on your behalf. I invoke the Schott Rule, which says that you have to wait one hour for each past Wo(G)E that you’ve won before answering. Posting time is 9:00am on Saturday, October 16.

Here it is:

Please note that north is off to the upper right. You can enlarge the screenshot to full-size by clicking through twice. Good luck!

Friday fold: wavelength contrast

I scored this photo off the Internet more than five years ago, the first time I taught Structural Geology at George Mason University. I failed to note the website I got it from, and now that website has apparently disappeared, at least as far as the view from Google is concerned. If anyone knows the provenance of this image, please let me know so that I can properly attribute it.

I hesitate to post something like this without knowing who took it, but I did note to myself that it came from the Point Lake Greenstone Belt in the Northwestern Territories of Canada. This image and its implications follow so nicely on to our discussion last week about fold wavelength and the Ramberg-Biot equation that I can’t resist it. Ready? Brace yourself…

point_lake_viscosity

I think that this is one of the coolest structural geology photos ever taken. Here it is graced with some annotations:

point_lake_viscosity_anno

Maximum compressive stress was in this case from the back to the front. The same vein, oriented ~parallel to σ1, is folded in two very different ways, depending on which rock type it is cutting across. As with a week ago, we can explain this behavior using the Ramberg-Biot equation:

L = 2 π t (η / 6ηo)

where L is the wavelength of the fold (in other words, the distance from one fold hinge to the next fold hinge); t is the thickness of the folded layer; η is the viscosity (resistance to flow) of the quartz vein (or, in general, the more competent of the two layers); and ηo is the viscosity of the rock unit (sandstone or shale) that the quartz vein cuts across.

If you keep t and η constant (for say, the rightmost of the two quartz veins), then the only thing left to vary would be ηo. So sandstone will have one ηo, while shale will have another ηo. The sandstone is more resistant to flowing than the shale is. The viscosity contrast between the quartz vein and the sandstone is less (they’re both made of quartz) than the viscosity contrast between the quartz vein and the shale (which have very different material properties).

The high viscosity contrast with the shale makes for a very big number, which raised to the ⅓ power (i.e., you take the cube root) makes for a very small number. This small number, multiplied by the constants of 2, π, and t, gives you L, which will also be a small number: hence the wavelength is small, and as a result, the folds are crunkled up next to one another like sardines in a can.

On the other hand, the low contrast between the viscosities of the quartz vein and the quartz sandstone means that you get a rather small number. Say η = 3. If ηo is also about 3, then you have: (3/(6*3)), or the fraction 1/6. Expressed as a decimal instead of a fraction, this is 0.167. Take the cube root of that, and you end up with a bigger number, in this case 0.55. Multiply that by 2, π, and t, and you get your new wavelength, L. Because you have a larger number in the (η / 6ηo) part of the equation, and everything else is the same, you end up with a larger wavelength. The result is only one fold antiform in the sandstone. In the neighboring shale, ~23 antiforms are packed into the same distance along strike of the vein.

Wild stuff, right? Happy Friday. Let’s hope your weekend is of sufficiently high contrast to the sludge of the week that you get all loose and wiggly, like the top part of the photo… : )

Rumeli Hisarı

Right after I got to Istanbul on this most recent trip, I took a taxi from my hotel down to the Bosphorus, to check out the Rumeli Hisarı, a fort complex built in 1452 by Sultan Mehmet the II in anticipation of the following year’s siege of Constantinople. It’s constructed at the narrowest point on the Bosphorus (660 m wide), with the aim of controlling boat traffic coming from the Black Sea. This narrow spot is today where they have the second of two bridges spanning the Bosphorus. It looks like this:

rumelihisari08

It’s in Europe; that’s Asia on the far right of the photo. A few more shots of the fortress’s pattern of towers and interconnecting walls:

rumelihisari04

rumelihisari05

rumelihisari01

Inside, I was pleased to note the variety of building stones. Here’s a nice porphyritic andesite which was a common constituent of the walls:
rumelihisari02

And a folded limestone:

rumelihisari06

Here are some yellowish blocks that are weathering away faster than the mortar which holds them in place. There is a Turkish 1-lira coin in front of the dark block near the center, to provide a sense of scale:

rumelihisari11

Here’s a similar phenomenon playing out with some bricks used to make an archway, except here the mortar is the more rapidly weathering component:

rumelihisari07

Check out this slab of brick… it’s got a curious adornment:

rumelihisari10

Zoomed in to show this detail:

rumelihisari09

Dog prints! Sometime a long time ago, maybe more than 500 years ago, a brick maker put out slabs of clay to dry, and some long-dead dog walked across it. The dog’s footprints are a kind of “historical trace fossil” that was then incorporated into this ancient structure.

Visiting the Rumeli Hisarı was a pleasant experience. I walked down along the Bosphorus next, peering into its surprisingly clear waters and counting jellyfish, then got a pide at a cafe. I caught another cab back to the hotel, and eventually fell asleep, a victim of jet lag…

rumelihisari03

Lola, the cartoonist’s companion

It’s been a while since I’ve posted any photos of my supremely helpful cat Lola on the blog, so here you go:

lola_cartoon_2

Lola loves to sit on paper, so when I break out the sketchbook to start working on my monthly cartoon for EARTH magazine, she sidles right up and stakes a claim. Fortunately, I was able to continue working in this case, as she wasn’t perched on the “active area” of the paper.

lola_cartoon_1

As you may be able to discern, the cartoon is about the newly-fraught relationship between geologists and the law… watch for it in December’s issue of EARTH.