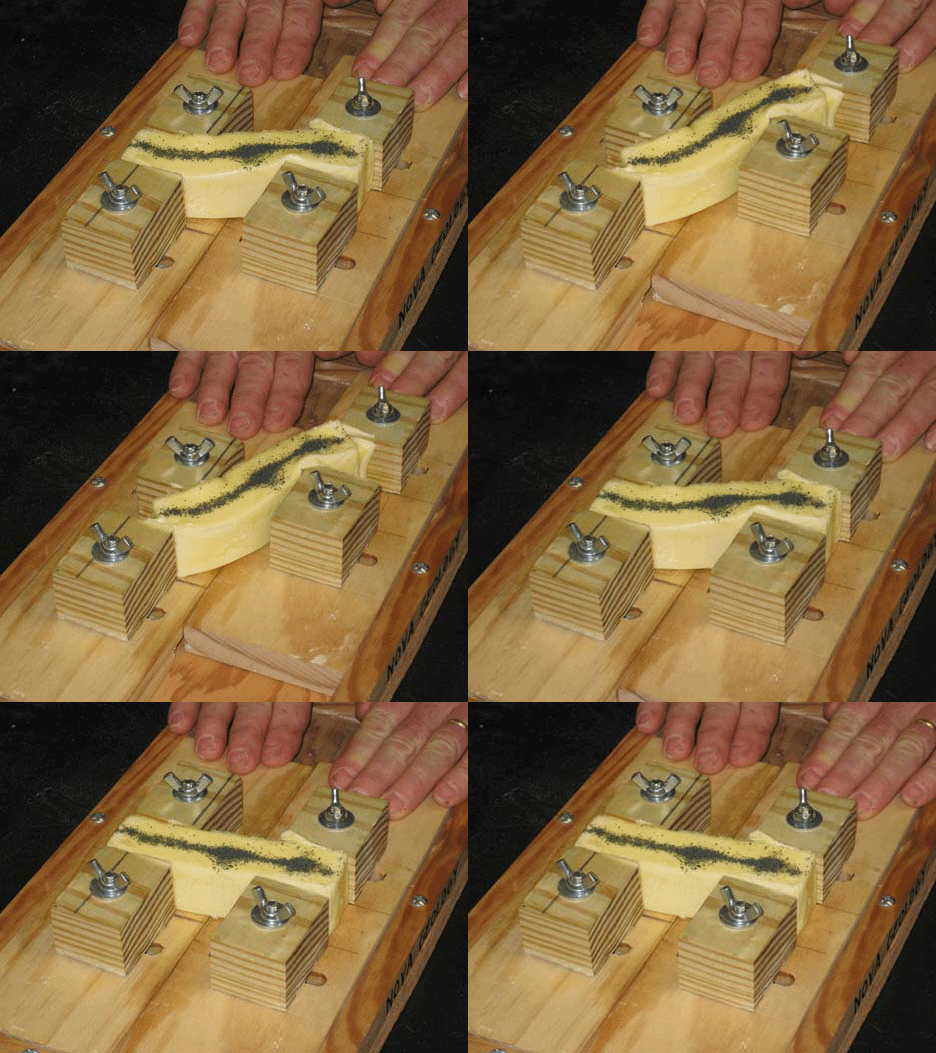
Friday fold: multilayer buckle folding demo

Check out this video I found online whilst uploading last week’s Friday fold:

This video was produced and published on YouTube by Markus Beckers, Michael Ketterman, Dennis Laux and Janos Urai.

It’s a nice demonstration of how multiple layers of material of different properties and different thicknesses can yield up different flavors of folds. In the movie, there are two materials present: white silicone and gray foam. The silicone layers are stronger (“more competent”) than the foam. But the two silicone layers are different thicknesses. It turns out that this ends up being a decisive factor in determining the way they fold.

We can explain this behavior using the Ramberg-Biot equation:

L = 2 π t (η / 6ηo)

where L is the wavelength of the fold (in other words, the distance from one antiform fold hinge to the next antiform fold hinge); t is the thickness of the folded layer; η is the viscosity (resistance to flow) of the silicone layer (or, in general, the more competent of the two layers); and ηo is the viscosity of the foam layers.

In other words, the (η / 6ηo) part of the equation reflects the viscosity contrast between the affected layers. In the video, this viscosity contrast is a constant, since we’re looking at two layers of the same stuff surrounded by the same matrix of other stuff. The only difference is the thickness of the two silicone layers.

So as far as our video up top is concerned, pay attention to the t value and the L value: the thicker the layer is, the larger the wavelength of the resulting fold. The thin layer has a lower t value, and so it ends up with a shorter wavelength: i.e., there are more folds packed into the same amount of vertical space as its stouter neighbor. The thick layer’s higher t value means it wıll have a proportıonately higher L value. It will have a longer wavelength, and fewer undulations will fit into the available vertical space.

Happy Friday, everyone! I’m heading back to DC tomorrow (from Turkey), so more regular posting wıll resume next week.

Lessons from a broken bottle

Whilst hiking at Dolly Sods over the weekend, I found this old artifact:

dollysods_20

Upper 10 is apparently a “Sprite”-esque lemon-lime soda, discontinued in America but still being marketed abroad. But that wasn’t what got me jazzed, of course. Look more closely…

dollysods_21

That is a lovely little conchoidal fracture, and it’s so exquisite because it preserves not only the concentric “ribs” that are typical of conchoidal fractures, but also delicate little traces of plumose structure. Note that the conchoidal “ribs” are parallel to the advancing joint front (leading edge of the fracture), and the plumes are perpendicular to the joint front.

Here’s an annotated copy to make this more explicit:
dollysods_21anno

The same pattern can be observed in a second fracture, this one located within the glass (not on the surface):
dollysods_22

Annotated copy:
dollysods_22anno

Nice! This is the same pattern that we observe with the fine-scale topography of joint surfaces in rocks, as I have blogged on several occasions.

Thank you, Upper 10, and thank you, nameless Dolly Sods litterbug, for providing us with this fine lesson in fracture anatomy.

Pristine stratigraphy vs. bioturbated

Beautiful fiancée for scale.

What does Callan see here?

leaves_puzzle

Tell me why I took this iPhone picture, and I’ll mail you a GEOLOGY ROCKS bumper sticker! Answer in the comments below…

Uniformitarian

polygonal_cracking_DC_map

Heat-stressed map of the Chesapeake Bay / Washington, DC region, as seen at Kenilworth Aquatic Gardens. Looks like mudcracks, eh?

Similar stresses; similar strains.

Butter Buster animation

A million years ago, I posted about my inaugural attempt to use the Butter Buster to illustrate shear zone deformation to my structural geology students.

Today, using the UnFREEz program to make an animated GIF (Thanks, Lockwood!), I give you the Butter Buster animation:

Sugarloaf

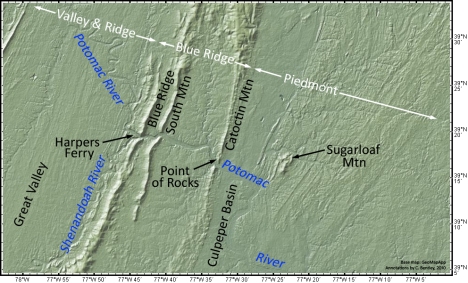
Sunday morning, NOVA adjunct geology instructor Chris Khourey and I went out to Sugarloaf Mountain, near Comus, Maryland, to poke around and assess the geology. Sugarloaf is so named because it’s “held up” by erosion-resistant quartzite. It’s often dubbed “the only mountain in the Piedmont,” which refers to the Piedmont physiographic province. Here’s a map, made with GeoMapApp and annotated by me, showing the general area:

A larger version of the map can be viewed by clicking here.

On the far west, you can see the Valley & Ridge province, which ends at the Blue Ridge Thrust Fault. Then the Blue Ridge province runs east from the Blue Ridge itself to Catoctin Mountain. From there, you enter the Piedmont, including both the “crystalline” Piedmont (Paleozoic metamorphism of various ocean basin protoliths, plus infusions of granite) and the Culpeper Basin, a Triassic/Jurassic rift valley. The Potomac River cuts a series of three spectacular water gaps across the Blue Ridge province just west of Sugarloaf. Harpers Ferry, West Virginia, is located at the confluence of the Potomac and the Shenandoah Rivers by the westernmost of these water gaps, and the name for the easternmost one is “Point of Rocks.”

Here’s a look at a detail from the southeastern corner of the geologic map of the Buckeystown, MD quadrangle, by Scott Southworth and David Brezinski:
sugarloaf_geol
sugarloaf_geol_key

The map pattern shows a that the area around Sugarloaf Mountain is a doubly-plunging anticlinorium of Sugarloaf Mountain Quartzite [SMQ] and overlying (younger) Urbana Formation. Overall, it’s got that typical “Appalachian” northeast-southwest trend. Notice the thrust fault on the west side: a typical hanging wall anticline? The ridges, including the summit of Sugarloaf Mountain itself, are held up by the toughest quartzite. This overall “squashed donut” shape shows up pretty well in the physiographic map up at the top of this post.

Sugarloaf is quartzite (metamorphic), but you can clearly see the sand grains that composed its protolith (sedimentary). There’s also reports of cross-bedding, and so Chris asked me to take a look at a few structures to assess them with my point of view. I found a pervasive cleavage in the rock, far more than I would have suspected would be there. We did find bedding exposed as compositional/grain size layers in several locations, including on the summit. I also paid a lot of attention to the many quartz veins which cut the metasedimentary quartzite. These veins of “milky quartz” are often arranged in lovely en echelon series, like these tension gashes:

tension_gash_array_sugarloaf_web

I took the above photo several years ago on a visit there, but it’s typical of the sorts of stuff we saw Sunday. The kinematic sense of this outcrop would be “top to the right.” Interestingly, none of the Sugarloaf outcrops show really deformed tension gashes (i.e., they’re not folded into Z or S shapes like those I showed you a few days ago).

What we really wanted to get a sense of, though, was which way was up in these rocks. We were in search of geopetal structures: primary sedimentary structures that indicate the “younging direction” of the beds. Graded beds can do this, though I didn’t see any unambiguous graded beds in the SMQ on Sunday’s trip. We wanted some cross-beds. We found some hummocky / swaley examples, looking approximately like this USGS photograph (black & white; hammer for scale) of an outcrop somewhere “north of the summit”:

crossbedding_USGS_sugarloafImage source: USGS

Ours wasn’t as beautiful as the one pictured above, but it was clearly hummocky cross-bedding, and it was right-side-up (in beds tilted at ~30°). Interestingly, the SMQ has been correlated by Southworth and Brezinski (2003) with the Weverton Formation of the Chilhowee Group, a rock unit exposed in the Blue Ridge. Just as the Weverton is overlain by the finer-grained Harpers Formation, so too is the SMQ overlain by a finer-grained unit, the Urbana Formation. Both are interpreted as metamorphosed continental margin deposits. The Urbana is mostly phyllite in the areas I’ve seen it (including phyllite that’s full of quartz grains, a first for me). The Urbana is well exposed in a creek-side outcrop north of Sugarloaf Mountain, and I took Chris there to show him the lovely intersection of bedding and cleavage.

Here is a weathered piece of the Urbana Formation that Chris collected there, looking at the plane of cleavage (ruler in background for scale):

urbana Image source: Christopher Khourey

You can see the bedding running ~horizontally across it, though the photo cannot convey the lovely phyllitic sheen that results from waggling these samples back and forth in good light. It’s pretty cool. In places, the transition from sandy to phyllitic is gradational, probably relict graded bedding.

So, what does it mean if Southworth and Brezinski (2003) are correct in their correlation, and the Weverton and the SMQ are really the same rock layer, but in different provinces and at different metamorphic grades? Recall that the Blue Ridge province to the west is also a thrust-faulted anticlinorium, launched up and to the west by the Alleghanian Orogeny from an original position deeper in the crust and further towards the east. It’s a shard of the craton, snapped off and shoved bodily up and to the northwest. (In class, I often liken it to Joe Theismann’s leg: a compound fracture of the continental crust.) Might the Sugarloaf Mountain Anticlinorium [SMA] be a smaller version of the Blue Ridge pulling the same trick? It too is arched up and snapped off …but it would be a “Mini-Me” that’s only just surfacing, like a baby whale swimming above momma whale’s back…

whales_analogy

We know that deeper down in the Blue Ridge stratigraphy, we find the Catoctin Formation, the Swift Run Formation, and the basement complex. If we drilled down through the crest of the SMA, would we find the same units (or more metamorphosed equivalents thereof)? It’s an intriguing thought…

Snowy décollement

Earlier in the month, during the big snowstorms, my window got plastered with snow. This snow formed a vertical layer which then deformed under the influence of gravity. Looking at it through the glass, I was struck by how it could serve as a miniature analogue for the deformation typical of a mountain belt.

Let’s start our discussion by taking a look at an iPhone photograph of the snow:

So here’s what I notice about this (vertically-oriented) photo:

The big sheet of snow is sliding downward over the face of the glass. This surface of slip is thus analogous to a low-angle thrust fault. Here, the maximum principal stress (known as σ1 to structural geologists) is gravity. The minimum principal stress (σ3) is perpendicular to the window, and the intermediate principal stress (σ2) is horizontal, parallel to the bottom edge of the window (i.e., left-to-right). As deformation proceeds, the snow slab folds up on itself and pooches outward in the area of least stress (σ3); away from the surface of the window.

As the snow layer moves downward, it creates a major fold which thickens the snow in a big line perpendicular to gravity, parallel to σ2. Along the vertical part of the window frame, the snow sheet has detached in a vertically-oriented fracture (i.e., parallel to σ1). Oblique to both σ1 and σ2 is a series of smaller folds with diagonal axes.

We can see a similar pattern in this map of the Himalayan mountain belt:

Note that the map* is oriented with north at the bottom, and south at the top, so as to be able to better compared it to my window. Note the broad arc of the Himalayan mountain front (~parallel to the Nepali border) which is perpendicular to the motion of India relative to Eurasia. The minimum principal stress direction (σ3) is vertical, which is why the mountains grow upwards (and the crust thickens downwards into the mantle, too, making the Himalayan mountain belt the site of the thickest crust on the planet). Along the edge of the impactor (analogous to our snow sheet), for instance in northern Burma, we see the same “splay” of folds with axes perpendicular to the the India-Eurasia convergence vector. The crust there is not as thickened.

Though a gooey slab of snow on my window isn’t a perfect analogue for Himalayan mountain-building, we can see some similarities in gross morphology — structural similarities that are fundamentally tied to the orientation of the principal stress directions.

_______________________________________

* Modified by me from a Google Maps “terrain” view.

Salamander shear

Whilst discussing how to quantify strain with my GMU structural geology students recently, I hit upon a cool analogy. In order for you to understand the analogy (assuming you’re not a structural geologist), I’ll have to review some background information first. Stick with it, and I promise you a salamander at the end.

Structural geologists are interested in how rocks deform. If we have some idea of the original shape of a rock element (say, an oncolite, or a cooling column, or a fossil, or more prosaically, a sedimentary layer), and we find a deformed version of it, then we can use that object as a strain marker. By measuring its features, we can determine how parts of the strain marker have elongated, shortened, or rotated.

Elongation is pretty easy to calculate. You compare the final dimensions to the original dimensions via the equation e = (lf-lo)/lo where “lo” is the original length and “lf” is the final length.

If the strain marker has been elongated, then the value of e will be positive. If it has been shortened, then the value of e will be negative. Another value, S (for ‘stretch’) is also a useful parameter to calculate. S = lf/lo, which is the same as saying: S = e + 1

As a quick example, a line which has been deformed from an original length of 20 cm to a final length of 30 cm has an elongation of 0.5. It has a stretch of 1.5. Put another way, the line has been increased in length by 50% (of its original length), and it is now 150% as long as it originally was.

Here’s a little diagram to summarize:

Okay — so far, so good. We can now calculate length changes. But many of the structural elements in a strain marker not only change their length, but also their orientation. That is to say, they rotate. In order to quantify that, we need to thinking about shear strain. Shear strain (γ), is calculated from angular shear (ψ), a quantity that is measurable in a rock element (again, provided you have a clear idea of what it looked like before deformation).

For any given line in a strain marker, angular shear is defined as the deviation (in degrees) from perpendicular for a line which was originally perpendicular to the line we care about. That is a ridiculous definition at first glance, and it seems to many students quite non-intuitive why one would bother looking for a line originally perpendicular to the line on which we are actually trying to measure the angular shear! I mean, is that abstractified or what?

Before I reveal my stunning new analogy for angular shear, let me diagram the definition for you, and relate it to shear strain.

The line we care about (blue) looks quite the same after deformation as it looked before deformation. So we can’t actually measure anything about it directly that has changed. But when we look at a line which we know was originally perpendicular to it (gray/red), we can measure how it has changed.

The angle between the old perpendicular-line and the new ‘perpendicular’- line is ψ, the angular shear. By convention, clockwise rotations of the perpendicular-line are given positive values, while counter-clockwise rotations are assigned negative values. In the above example, the rotation is clockwise by 35°, so we note it as “ψ = +35°”.

Another way to think about this situation is to consider any point on our perpendicular-line. Here, let’s consider point A:

A was originally at the end of the old perpendicular-line (gray), in position Ao. After deformation, it is now at the end of the new ‘perpendicular-line’ (red), in position Af. You can see that this outlines a right triangle (yellow):

Right triangles are lots of fun, because they allow us to practice trigonometry. You may remember the mnemonic phrase “SOHCAHTOA” from your high-school trigonometry class. Basically, this relates the angle ψ to the lengths of the sides of the right triangle, where S refers to sin(ψ), C refers to cos(ψ), and T refers to tan(ψ). (That’s sine, cosine, and tangent, respectively.) “O” is the length of the side opposite the corner of the triangle with the ψ angle. “A” is the length of the non-hypotenuse side adjacent to the ψ-angled corner. “H” is the length of the hypotenuse itself. So the change in the position of point A, which could be expressed as Δ(A), is equal to the length of the ‘opposite’ side relative to the length of the ‘adjacent’ side of the triangle. The length of the adjacent side isn’t changing through this deformation, but the length of the opposite side is changing. With a little deformation, it changes a little. With a lot of deformation, the length of that O side increases dramatically.

The formula for calculating shear strain from angular shear is: γ = tan(ψ)

So, with a large value of ψ, you get a large value for tan(ψ). The shear strain (γ) increases along the line we care about (blue) with increasing rotation of the ‘perpendicular’-line (red). The maximum value of ψ would be approaching 90°, which means that your γ would be close to infinity. The minimum angular shear, 0°, would yield a shear strain of 0. Here’s a table of other possible values.

Okay, got it? …(Whew!)

Now for the salamander!

In order to express to my structure students why we bother to pay attention to that ‘perpendicular’-line, I wanted to get them into the perspective of the line we care about: I wanted to get them into its mindset. But of course, lines are geometric entities, and don’t have minds. They are hard to identify with. So I opted for a salamander, because they are cute. Furthermore, salamanders are roughly linear organisms, and have legs poking out of them at roughly right-angles to their spinal column. Here’s my blackboard sketch:

So if you think about what the salamander experiences as it gets sheared (right-lateral), you can imagine what shear strain feels like. The legs go from an original orientation (purple chalk) to a deformed orientation (blue chalk), rotating by about 45°. Along the length of the salamander’s body (orange chalk), the angular shear is 45°, and the tangent of 45° is 1. So the shear strain along the length of this poor salamander is 1. What this means is that the tips of the salamander’s toes (the equivalent of point A in the earlier diagrams) have moved one whole leg-length to the right of their original positions. You can put some numbers to this if you want: Say the leg length is 1.5 cm, and the toes are displaced 1.5 cm. Remember SOHCAHTOA… γ = tan(ψ) = opp/adj = 1.5/1.5 = 1.

There’s something else on the diagram, too: a yellow line. This makes the point that if the leg-line of the salamander is the “line you care about,” and not the spine-line, then the spine-line can be “the line originally perpendicular to the line you care about.” If you’re measuring the angular shear along the leg lines, you would want to measure how the spine-line has rotated relative to its original position. As a result of the shearing deformation in this example, the spine-line has rotated by 45° counter-clockwise. So we’d say: “ψ = -45°”. The tangent of -45° is -1. The shear strain on the leg-line is therefore exactly the opposite of the shear strain on the spine-line.

But the key point of this analogy is to put your mind in the salamander’s perspective, and “feel” the shear strain along the length of your body as deformation proceeds. I hope that intuiting shear strain from that perspective will be useful to structure students learning these concepts.

Normal fault in hedgetop snow stratum

Intersection of 16th Street and Columbia Road NW…

… a wee bit underexposed, eh? Guess the high albedo blew out my iPhone camera. (glove for scale)